- General
-
 Questions

Missing Signal Values
I am having some trouble downloading data in the R API/package. It all seems to work fine but I am not getting any signal values. If I download this same data as a bed file there are signals in this range of positon values, but if I download it in R I don't get any values in the signal value column.
R code:
`
id <- deepblue_select_experiments(experiment_name = "E050_WGBS_ReadCoverage.bedgraph", chromosome = "chr6", start=26330464, end=26330664)
request <- deepblue_get_regions(query_id = id, output_format = "CHROMOSOME,START,END,SIGNAL_VALUE")
region <- deepblue_download_request_data(request_id = request)
region
`
Result:
`
Called method: deepblue_select_experiments
<span class="ace_constant ace_language">Reported status was: okay
Called method: deepblue_get_regions
Reported status was: okay
Called method: deepblue_info
Reported status was: okay
Called method: deepblue_info
Reported status was: okay
trying URL 'http://deepblue.mpi-inf.mpg.de/xmlrpc/download/?r=r791736&key=anonymous_key'
Content type 'application/x-bzip2' length 124 bytes
==================================================
downloaded 124 bytes

Decompressing downloaded file to /tmp/RtmpZfobRp/file495c5e0585df_uncompress
Reading file from /tmp/RtmpZfobRp/file495c5e0585df_uncompress
</span>GRanges object with 18 ranges and 1 metadata column:
       seqnames               ranges strand | SIGNAL_VALUE
          <Rle>            <IRanges>  <Rle> |  <character>
   [1]     chr6 [26330521, 26330522]      * |
   [2]     chr6 [26330522, 26330523]      * |
   [3]     chr6 [26330544, 26330545]      * |
   [4]     chr6 [26330545, 26330546]      * |
   [5]     chr6 [26330552, 26330553]      * |
   ...      ...                  ...    ... .          ...
  [14]     chr6 [26330602, 26330603]      * |
  [15]     chr6 [26330603, 26330604]      * |
  [16]     chr6 [26330604, 26330605]      * |
  [17]     chr6 [26330644, 26330645]      * |
  [18]     chr6 [26330645, 26330646]      * |
  -------
  seqinfo: 1 sequence from an unspecified genome; no seqlengths
`
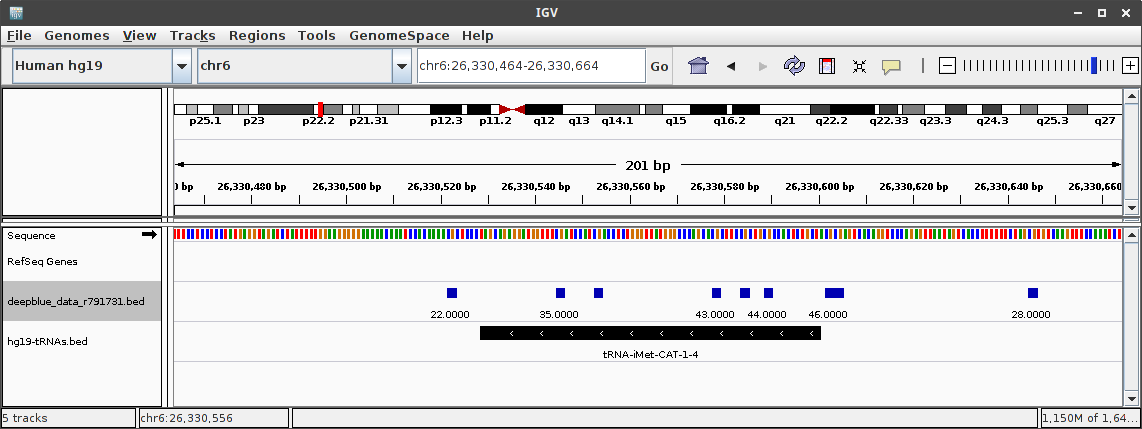
Bedfile downloaded from the web interface open in IGV:
Any Suggestions?
Customer support service by UserEcho

Hello Richard, thank you for the complete information.
You made a small mistake in the output format. You must use the column "VALUE" rather than "SIGNAL_VALUE".
The signal column in the wiggle files is called simply 'VALUE'.
The working example is here:
library(DeepBlueR)id <- deepblue_select_experiments(experiment_name = "E050_WGBS_ReadCoverage.bedgraph", chromosome = "chr6", start=26330464, end=26330664)request <- deepblue_get_regions(query_id = id, output_format = "CHROMOSOME,START,END,VALUE")region <- deepblue_download_request_data(request_id = request)regionOutput:
> regionGRanges object with 18 ranges and 1 metadata column:seqnames ranges strand | VALUE<Rle> <IRanges> <Rle> | <character>[1] chr6 [26330521, 26330522] * | 22.0000[2] chr6 [26330522, 26330523] * | 22.0000[3] chr6 [26330544, 26330545] * | 35.0000[4] chr6 [26330545, 26330546] * | 35.0000[5] chr6 [26330552, 26330553] * | 35.0000... ... ... ... . ...[14] chr6 [26330602, 26330603] * | 46.0000[15] chr6 [26330603, 26330604] * | 44.0000[16] chr6 [26330604, 26330605] * | 44.0000[17] chr6 [26330644, 26330645] * | 28.0000[18] chr6 [26330645, 26330646] * | 28.0000-------seqinfo: 1 sequence from an unspecified genome; no seqlengths
Please, let me know if you have further questions and thank you for posting this question here!Thanks Felipe,
I thought it would be something simple like that.
I was going based on the examples in this vignette:
http://bioconductor.org/packages/release/bioc/vignettes/DeepBlueR/inst/doc/DeepBlueR.html#output-with-selected-columns
In which SIGNAL_VALUE is used, is there some way of finding out what the available column headinsg are for a given dataset so I can avoid this sort of diffficulty in the future?
Hello Richards,
the SIGNAL_VALUE is a column defined in the 'bed' files.
As a rule of thumb, you can assume that all signal files have the format: "CHROMOSOME,START,END,SIGNAL". We are working to give a more meaningful name for the 'SIGNAL' column, but it is a work in progress.
You can obtain the experiments columns using the info() command:
Example:
# Obtain the ID from the experiment name:
id_name <- deepblue_name_to_id("E050_WGBS_ReadCoverage.bedgraph", collection="experiments")
# Obtain information about the experiment:
info <- deepblue_info(id_name$id)
# Print the experiment format:
info$format
# More detailed view of the experiment columns/format
info$columns
I hope that it is what you are looking for.
Please, let me know if you have further questions!